To view these projects as they were intended to be seen, please visit this portfolio on a desktop screen. A tailored mobile experience is currently in development.
Note
I apologize for any inconvenience caused.
Interwoven Text
Submission for Figma Makeathon 2026
Software used: Figma Make, Claude Opus 4.6
TLDR
Interwoven Text reimagines book discovery as a highly visual experience. Instead of static summaries, it reveals how ideas overlap across different works through interactive radial and thematic maps. This Figma Makeathon project focuses strictly on pushing the boundaries of data visualization.
Date
February–March 2026
Role
Solo UI/UX Designer
Topics
Data Visualization
Information Architecture
Overview
Interwoven Text visualizes books as an interwoven web centered around core concepts. This lets you explore surprising links between titles, follow thematic journeys, and discover new reads that deepen your understanding of any central idea.
Three complementary visualizations bring this idea to life:
1. Radial Map
2. Thematic Journey Map
3. Book Library
Problem
Traditional book discovery relies on flat, static lists or basic algorithms. Readers looking to explore complex ideas struggle to visualize how different books, authors, and philosophies actually connect to one another.
Goals
1) Zero cognitive overload despite dense information
2) Scalable, color-coded system for 60+ books and 28+ themes
3) Intuitive, explorable data visualizations that feel natural and delightful
4) Support serendipitous discovery while allowing deep, focused dives
Radial Map
Radial Node Mesh:
A circular constellation map where books form interconnected nodes and themes create the outer ring. It instantly reveals the strength and direction of relationships, turning abstract connections into something visible.
Reasoning Behind Design
Scalable & Organized:
Despite the high information density, the circular structure + generous whitespace keeps the interface clear and visually balanced.
Synthesis-focused:
Unlike the per-book radial journey, this view provides a big-picture synthesis it shows how several books contribute to the same powerful ideas and how those ideas overlap across the library.
Interaction Design
Interactive & Exploratory:
Hover interactions highlight relevant connections, allowing users to dynamically explore relationships without cluttering the screen.

Unhovered State

Hovered State
Rationale
Built around progressive disclosure to reduce cognitive load and create exploratory interfaces that capture attention while rewarding curiosity.
Color-coded System:
Each major theme has its own distinct color, making relationships instantly scannable even with 60+ books and 28 themes.

Interaction on a Theme
Interaction on a Book
Rationale
Giving each major theme its own distinct color creates instant scannability
Interlinking upon Hover:
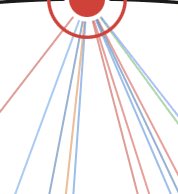
Thin colored lines show relationships between the central book, other books, and overarching themes.
Multi-layered Connections

Theme Node Origin
Rationale
Color-coded lines bridge central books, related titles, and themes to reveal complex relationships at a glance.
Thematic Journey Map
The Thematic Journey Map shows how a single book branches into multiple interconnected conceptual pathways, letting users explore how core ideas evolve through different themes.
Design Purpose:
By centering the book and radiating its ideas outward, this view transforms a single title into a rich, living network of concepts. It makes abstract thematic connections tangible, intuitive, and intellectually satisfying turning passive reading into active discovery.
1
Adaptive Branching Structure:
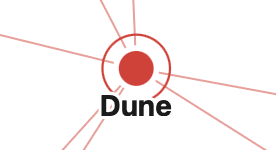
To reflect the true narrative density, color-coded branches scale per book (e.g., seven for Dune), replacing fixed templates with dynamic data maps.
2
Hierarchical layout:
Each branch contains 3–4 related sub-concepts arranged logically from broad theme to specific ideas, creating clear visual hierarchy.
3
Delightful micro-interactions:
Hovering over a node or line highlights the full relationship path. A tooltip reveals the concept name and a contextual quote, making discovery fluid and intuitive.
4
Progressive disclosure:
Only essential information is shown by default, keeping the interface clean and focused even with dense content.
Interaction Design + Information Design
Hover States
When a user hovers over any node or branch in the Book Theme Journey, the entire pathway from the central book node to the hovered concept lights up brightly. At the same time, the rest of the tree gently dims. This creates a clear visual focus on the selected thematic path.
Instant Context & Insights: Reveal hidden labels and precise concept names simply by hovering.
Theme Quick View
Colored dots provide direct access to the book's major themes. Selecting a theme highlights its branch and related concepts while dimming the rest of the tree, making the thematic path easier to follow.
Book Library
A clean, scannable grid displaying all 60 books. Each card features a category indicator, book title, author name, and category label.

Hover States
Hovering over a book card highlights it with a subtle colored border and light background matching the book’s category color. The category label also becomes bold and fully colored, providing clear visual feedback and helping users quickly identify the selected book.


Iterations
Radial Map

1
Radial Branching Map
This tree structure was generated using a fractal tree algorithm in Python. However, it proved to be a poor fit for the project, as it reduced node visibility and limited each tree to a maximum of eight nodes.

2
Cluster Nodes
Each book acts as a central node, with its themes shown as connected child nodes. A collection of these books forms a cluster constellation.
While the design supports zooming in and out, it becomes visually overwhelming when viewed as a whole. Adding more books would make the graph significantly denser, increasing cognitive load and potentially causing decision paralysis.
2. Thematic Journey Map

1
Single-book directed network graph
This was an earlier variation that included decentralised book lending, where the main node is the book, and the donor, reader, and current reader form the child nodes, with directional flow indicating the book’s journey.

2
Single-book directed network graph
An interactive highlight showing the reading journey and connections for the book.

3
Single-book directed network graph
Shows the flow of information between users, illustrating how multiple paths converge at a central point before continuing to another user.

4
Directed network graph
A book review section for understanding the book from people and social proof.

5
Book Journey Clusters
A multi-book overview showing several book clusters, each with connected readers, donors, and current readers in a network layout.

6
Societal Idea Flow Network

7
Reader Journey Path Diagram
8
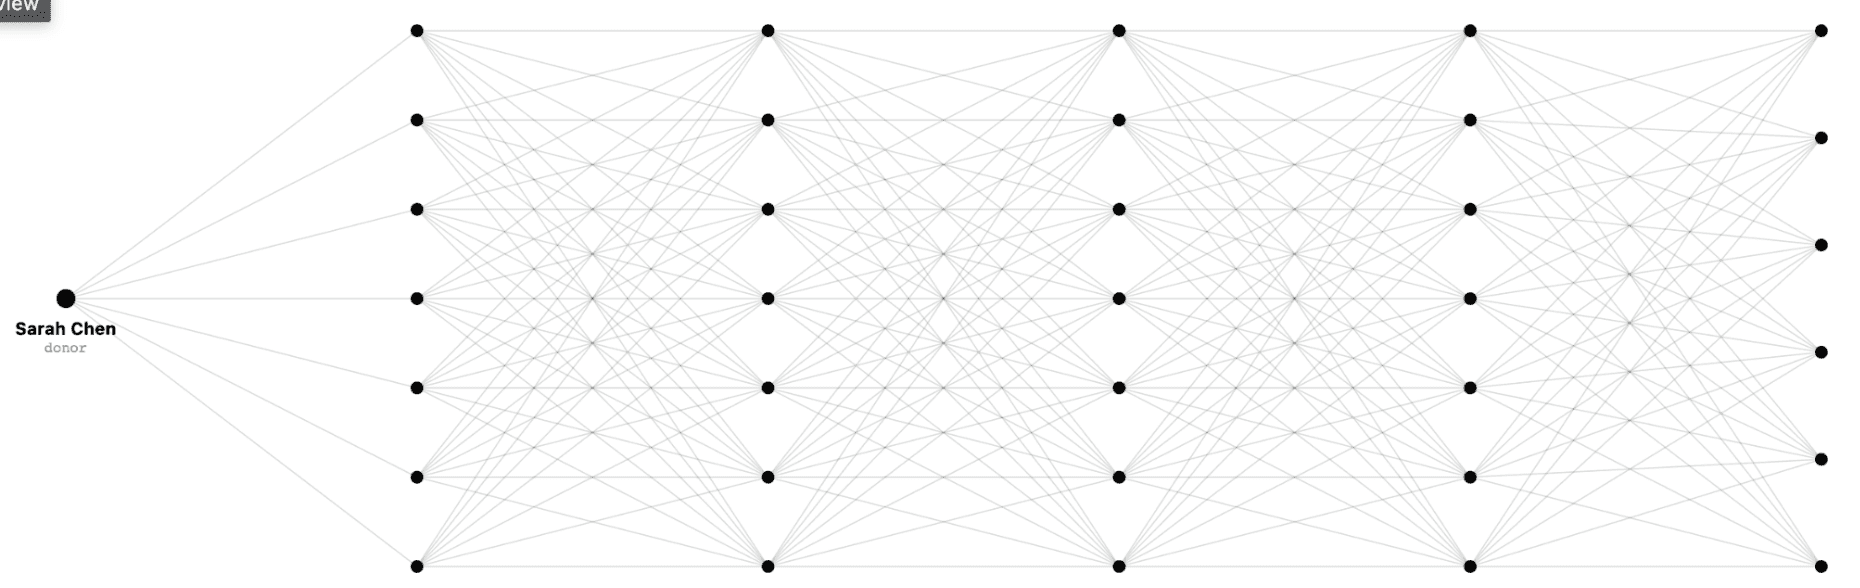
Dense Network Graph
3. Book Library
1
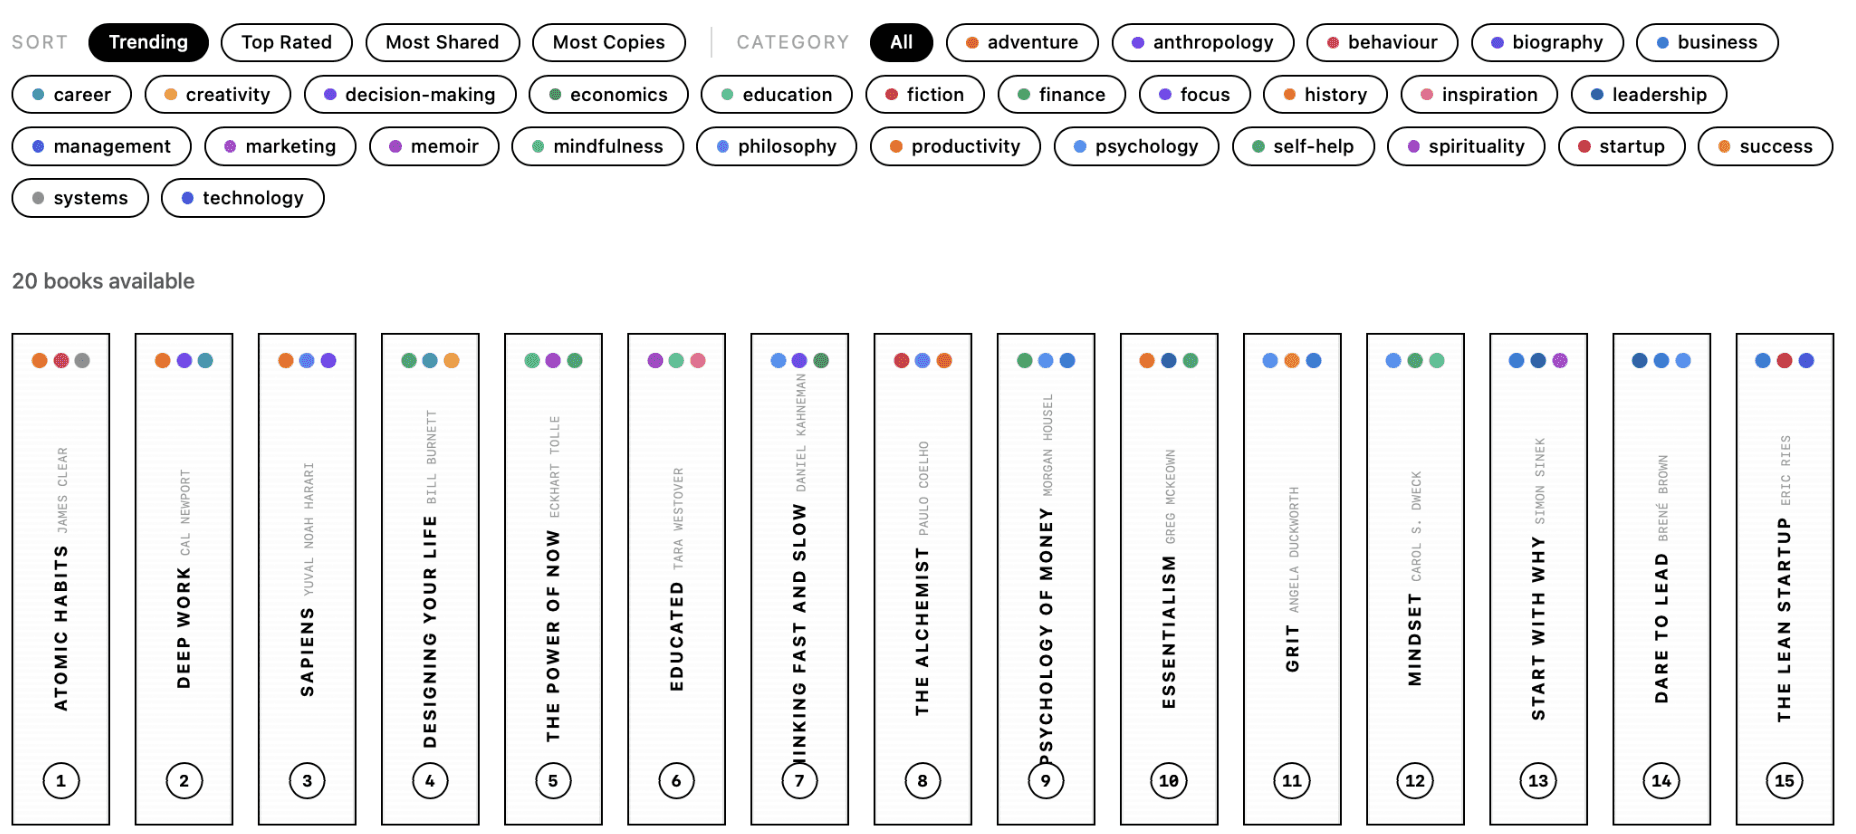
Book Browsing Grid
The books are color-coded with up to six colors to represent their themes. Clicking on a category filter will display only the books matching the selected themes while reducing the opacity of the remaining books.

2
Sort and Filter Bar
Key Learnings
01
The Mobile Screen Constraint: Data visualization interfaces often require large screens, making them difficult to use effectively on mobile devices.
02
AI Model Transition Risks: Claude Opus 4.6 is no longer available, executing future changes with alternative AI models remains highly uncertain due to their limited context windows and inferior project memory retention.
03
Development of Distinct Systems: Different visualization models revealed different strengths, leading to the development of three distinct systems: the Radial Map, Thematic Journey Map, and Book Library.
Future Exploration
01
User Testing: Test the system with readers to better understand how people interpret and navigate thematic relationships.
02
Cognitive Overload Risks: Combining all visualization aspects offers a cleaner solution, but accommodating that volume of data triggers severe cognitive overload and decision paralysis.
03
Prompt Context Optimization: Increase the amount of contextual information provided in the prompt to guide the AI model, enabling it to generate more precise results despite compressed memory history. This can help reduce hallucinations and improve token efficiency.
Case Studies